Up
Previous Next Sheriff CSM™ Vulnerabilities Assessment Overview sections
The Vulnerabilities Assessment Overview page includes the buttons, shown in the following table.
Vulnerabilities Assessment Overview page button meanings
You can also see the summary of vulnerabilities by going to Dashboards > Overview > Vulnerabilities.
Previous Next Sheriff CSM™
Vulnerabilities Views


This overview examines the vulnerability statistics across all scans.
You can also display the results, called scan reports, as HTML or export them as a PDF or Excel file. To see the summary of vulnerabilities, go to Environment > Vulnerabilities > Overview.
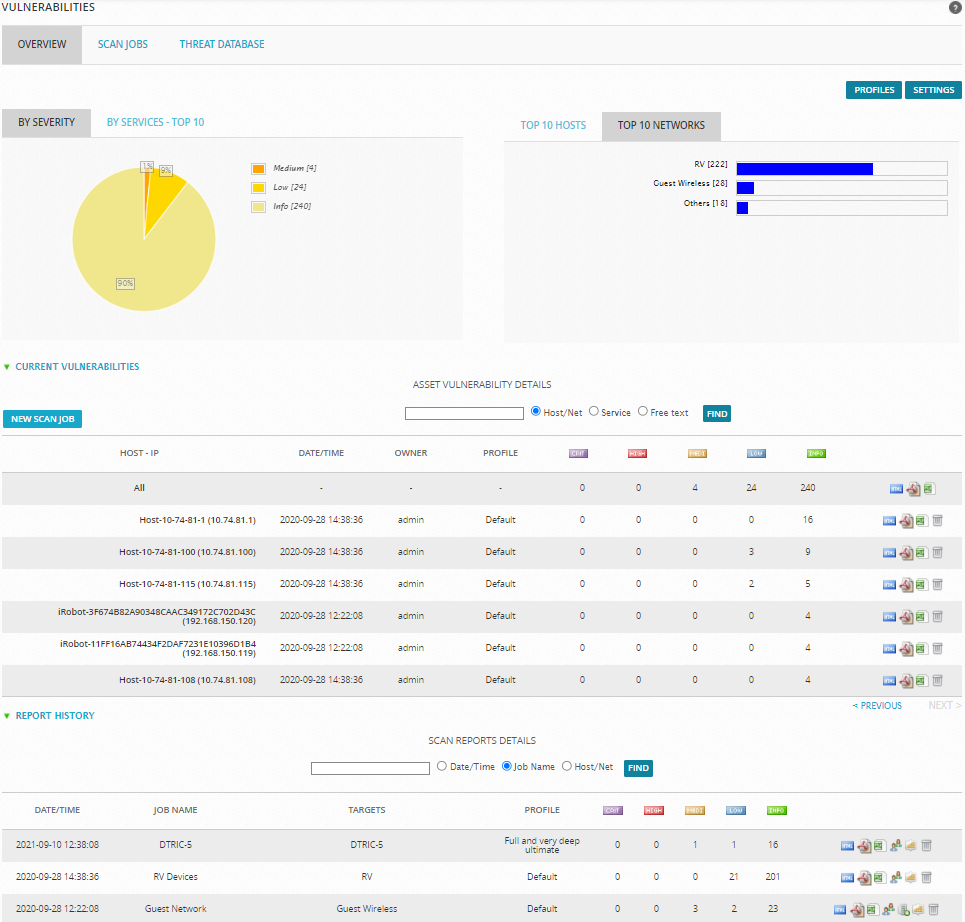 Vulnerabilities Assessment Overview sections
| Section Name | Description |
|---|---|
| By Severity |
A pie chart that displays:
|
| By Services-Top 10 | A pie chart that displays vulnerabilities from the top 10 services. Click within the chart to filter the vulnerabilities related to a service. And then click Overview to refresh the view of all services. |
| Top 10 Hosts | A horizontal bar graph displays the top 10 hosts with the most vulnerabilities. Click a host to filter the vulnerabilities related to that host. And then click Overview to refresh the view of all hosts. |
| Top 10 Networks | A horizontal bar graph displays the top 10 networks with the most vulnerabilities. Click a network to filter the vulnerabilities related to that network. And then click Overview to refresh the view of all networks. |
| Current Vulnerabilities | Summarizes the vulnerabilities found in the scan jobs. The first line refers to all scans. The next lines refer to every host. Vulnerabilities are classified by importance (Serious, High, Medium, Low and Info). For related information, see Changing the Vulnerability Ticket Threshold. |
| Reports | Displays the results from every scan. (See Viewing the Scan Results.) Classifies vulnerabilities by importance (Serious, High, Medium, Low and Info). For related information, see Changing the Vulnerability Ticket Threshold. |
| Button Name | Definition |
|---|---|
| Profiles | Opens the Vulnerability Scan Profiles page. (See also Customizing Vulnerability Profiles.) |
| Settings | Opens the Vulnerability Scan Settings page. (See Creating Credentials for Vulnerability Scans.) |
| New Scan Job | Creates a scan job. (See Creating Vulnerability Scan Jobs.) |
This topic: Sheriff > UserGuides > SheriffCSMDocumentation > UserGuide > VulnerabilityAssessment > VulnerabilityViews
Topic revision: 08 Mar 2022, SheriffCyberSecurity
Topic revision: 08 Mar 2022, SheriffCyberSecurity
Copyright 2020 Sheriff Cyber Security, LLC. All rights reserved.