Previous Next Sheriff CSM™
Viewing the Scan Results in HTML
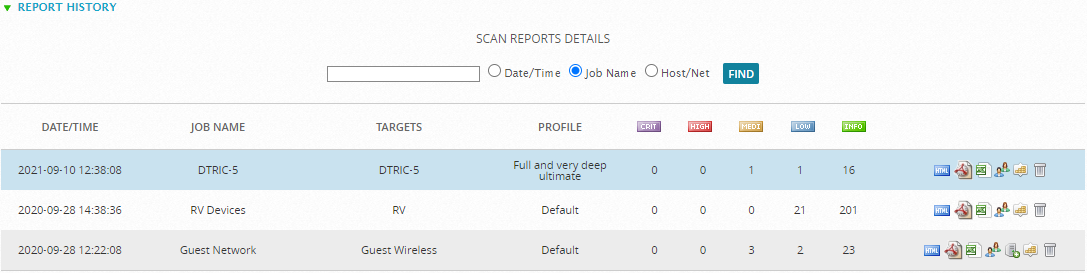
To view the results of the scan report in HTML within the same browser- Go to Environment > Vulnerabilities > Overview.
-
Click Reports if that section has not been expanded.
-
Click the HTML (
 ) icon on the scan job that you want to see.
The HTML report appears on the same page.
HTML report elements
Element
Definition
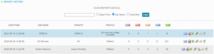
Scan Time
Time in which the report was made. It has the following format: yyyy-mm-dd hh:mm:ss.
Profile
Profile name that was chosen when the job was created.
Generated
Time it took to generate the report, in the format: yyyy-mm-dd hh:mm:ss.
Job Name
Name given to the job.
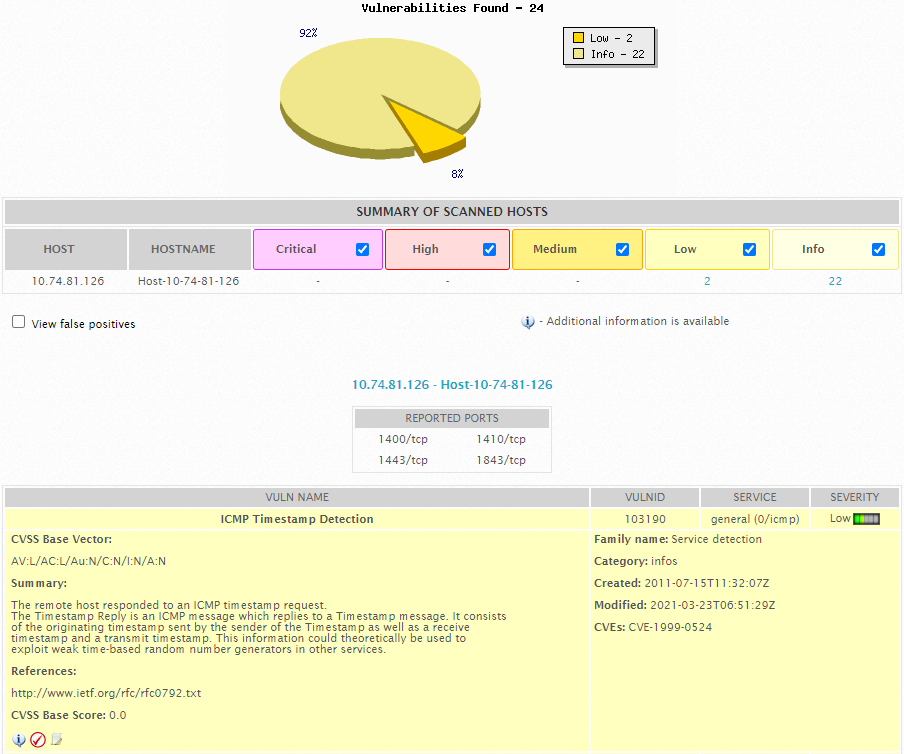
Chart Pie
A pie chart that displays all found vulnerabilities by severity, in percentages and in colors.
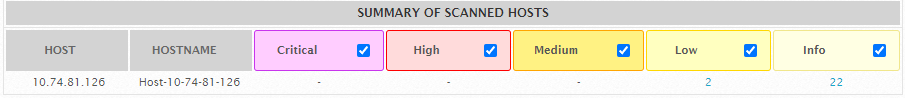
Summarcally of scanned hosts
It displays the following table:
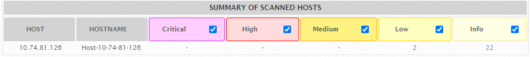
Select the checkbox to enable the risk level view.
Vulnerability Details
This table includes the vulnerability name, the vulnerability ID, the service name, and the severity of that vulnerability.
The background color refers to the type of vulnerability: pink = Serious, salmon = High, gold = Medium, yellow = Low, and light pale yellow = Info.
Topic revision: 10 Jan 2022, SheriffCyberSecurity