Previous Next Sheriff CSM™ Verifying Sheriff CSM Operation Once the basic installation and configuration of your Sheriff CSM system is completed (as described in the Sheriff Vigilante Deployment Guide), you can use the Sheriff CSM web UI to verify that it is operating properly. The following process describes tasks you can perform to verify basic operations, also walking you through information available from the five top-level menu selections:
-
When you first launch the Sheriff CSM web UI, it displays the main dashboards page.

This high-level view of summary information shows the overall state of your network, so you can get an immediate indication of the levels of events and alarms occurring in your environment.
-
Confirm that security events are being collected, and populating the Sheriff CSM database correctly. To see events in the database, navigate to the Analysis > Security Events (SIEM) view.
")
On this screen, any normalized log event, or any other event received or generated by any Sheriff CSM Sensor at the application, system, or network level, appear in the lower portion of the display, unless a Sheriff CSM policy has filtered it out. In the top portion of the screen, you can further search for and filter out specific events using time ranges and other search criteria. In the tabular list of events, shown in the lower portion of the display, you can click on a specific event row to display additional information for the selected event, in a popup window. You can view and examine full details about an event, in a full browser window, by clicking the
 icon in the last column of the event row.
 -
Confirm that Sheriff CSM is creating alarms and the alarms are displaying correctly. The Sheriff CSM Server uses a formula based on Asset Value, Event Priority, and Event Reliability to calculate an individual event’s risk. Any event with a risk of 1 or greater will generate an Alarm. (See Sheriff CSM Network Security Concepts and Terminology for a description of how event risk is calculated.)
To see alarms in your system, go to Analysis > Alarms.

By default, the middle portion of the screen provides a graphical representation of current alarms being generated in your environment. Blue circles indicate the number of alarms in a category that are appearing at a particular time. A bigger circle indicates a higher number of alarms. Alarms are prioritized by categories that reflect typical methods used by attackers. (See Alarm Management for more information on alarm categorization.)
The lower part of the window displays a tabular list of alarms.

Clicking on an alarm row displays full detail about the alarm, such as the events that triggered the alarm, source and destination IP addresses, and vulnerabilities associated with the alarm.
In the top portion of the screen, you can further search for and filter alarms that are displayed on this page. For example, you can choose to display only alarms originating from a particular sensor, have a certain risk level, or affect only certain groups of assets.
-
Confirm that raw (normalized) log information is being stored in the Sheriff CSM Logger.
The Sheriff CSM Logger provides a file-based archive repository that is specially designed to store security log information for long-term archiving and retrieval. Every hour, the archive log files are indexed, compressed and digitally signed to ensure their integrity. You can verify if the Sheriff CSM Logger component is receiving raw log events from network devices by viewing the data in the Raw Logs screen.
To see the logs, go to Analysis > Raw Logs.

The upper part of the window displays a chart, where you can see the log trends in the time frame you have set.
Logs are displayed in the lower part of the window. You can see details about an individual log entry by clicking the corresponding item in the list. You can also use the search box to search for specific log entries, for example, you could search on the name or location of a log file, or the source or destination IP addresses involved in a logged event. You can also select a time range in order to display log entries only for the selected time range.
-
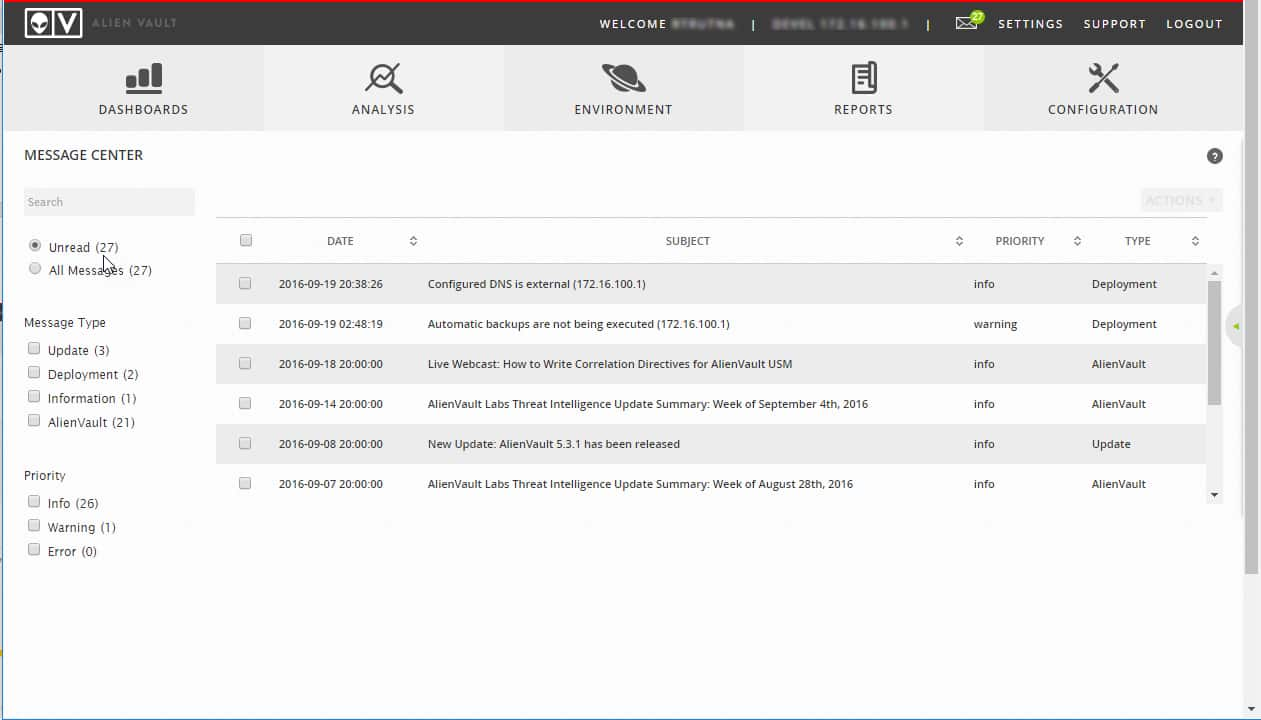
Click the Message (
 ) Center icon to observe any system information, error, or warning messages in the Message Center to determine if there are any outstanding issues reported by the Sheriff CSM Server. The display reports also any issues which occurred with the Sheriff CSM system components or log collection operations.
The Message Center is where you can receive messages about potential issues with the operation of Sheriff CSM Server or other components. The Message Center also provides information about available system updates. The Sheriff CSM web UI displays a list of messages related to any potential issues it detects, in addition to other informational and system update messages.

")