Previous Next Sheriff CSM™
Verify that an Enabled Plugin Is Working Properly
It's good practice to test whether or not a plugin is working correctly, after you have enabled it in Sheriff CSM and configured the application or device to forward logs to Sheriff CSM. Note: You can confirm the plugins enabled at the Sensor (Deputy) level by viewing the[plugin] section of the /etc/sensor/agent/config.cfg file. Per-asset plugin configurations are stored in the /etc/sensor/sensor/config.yml file.
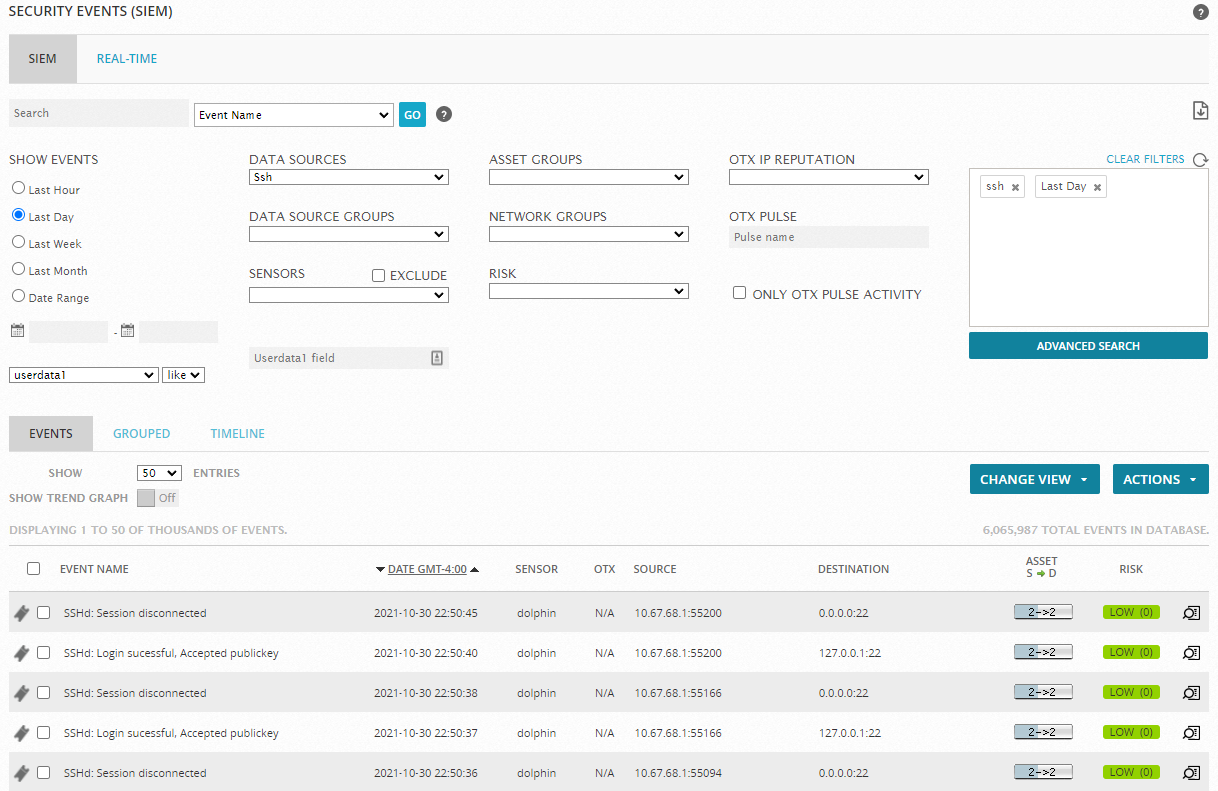
To confirm an enabled plugin is working properly - In the Sheriff CSM web UI, go to Analysis > Security Events (SIEM).
-
In Data Sources, select the plugin for which you expect to see events.


-
Connect to the Sheriff Console through SSH and use your credentials to log in.
The Sheriff Setup menu displays.
-
On the Sheriff Setup main menu, select Jailbreak System to gain command line access.
Select Yes when prompted. You will be in the root directory.
-
Validate that you are receiving syslog packets from the source device.
tcpdump –i eth0 –v –w /dev/null src <device_IP_Address> and port 514
Replace
<device_IP_Address>with the IP address you are collecting syslog data from.
-
Connect to the Sheriff Console through SSH and use your credentials to log in.
The Sheriff Setup menu displays.
-
On the Sheriff Setup main menu, select Jailbreak System to gain command line access.
Select Yes when prompted. You will be in the root directory.
-
Check log files for new messages.
Messages from your device appear in different files depending on how the plugin is enabled.
- If the plugin is enabled on a per-asset basis, incoming syslog messages are saved in
/var/log/Sheriff/devices/<asset_IP>, one folder per asset IP address.tail -f /var/log/sheriff/devices/<asset_IP>/<asset_IP>.log
- If the plugin is enabled at the Sensor level,
rsyslogis often configured to forward messages to a unique file, which is defined in thelocationparameter under the[config]section of the plugin file. After you have identified the file, type the followingtail -f /path/to/<data-Source-name>.log
- If syslog messages do not appear in either files mentioned above, you can check the default location for all syslog messages.
tail -f /var/log/syslog
- If the plugin is enabled on a per-asset basis, incoming syslog messages are saved in
rsyslog configuration directs the messages to the correct file. Restart rsyslog if needed.
/etc/init.d/rsyslog restartIf you see new messages in the log files, but there are no events, the error is in either the plugin or the agent configuration.
-
Connect to the Sheriff Console through SSH and use your credentials to log in.
The Sheriff Setup menu displays.
-
Select Maintenance & Troubleshooting.
-
Select Troubleshooting Tools.
- Select View Sheriff Components Logs.
-
Select View Sheriff Agent log.
After confirmation, the content of
/var/log/Sheriff/agent/agent.logwill be displayed in the console. You can press "q" to return to the menu. -
Search for the plugin name in the log file.
For example, type "/ssh" and press Enter. If the plugin is running, you should see output similar to the following
WatchDog[24430] Checking process sshd for plugin ssh
WatchDog[24430] plugin (ssh) is running
WatchDog[24430] plugin (ssh) is enabled
-
In addition, you will see information about the plugin outputted every 10 seconds. For example
Aug 10 13:01:24 Sheriff-Agent[INFO]: ssh[4003] Total lines [12759] TotalEvents:[643] EPS: [0.00] elapsed [10.01] seconds
Aug 10 13:01:34 Sheriff-Agent[INFO]: ssh[4003] Total lines [12759] TotalEvents:[643] EPS: [0.00] elapsed [10.00] seconds
Aug 10 13:01:44 Sheriff-Agent[INFO]: ssh[4003] Total lines [12859] TotalEvents:[683] EPS: [4.00] elapsed [10.00] seconds
where-
Total lines [12759]shows the number of lines (in the data source log file) that the plugin has processed after it is enabled. -
TotalEvents: [643]shows the number of events that the plugin has generated from those lines. -
EPS: [0.00]means Event Per Second and it is calculated every 10 seconds.EPS 0.00 indicates that zero event has been generated in the last 10 seconds; EPS 4.00 indicates that 40 events (683 - 643) have been generated in the last 10 seconds.
-
elapsed [10.01]seconds indicates that this information is gathered every 10 seconds.
-
Total lines and TotalEvents may not be the same because not every line can be turned into an event. If TotalEvents is 0, it means that the plugin has not generated any event. If Total lines is also 0, it means that the data source log file is empty, so the plugin has no data to process. But if Total lines is not 0, it means that the plugin does not turn those lines into events. You can look at the plugin configuration file to investigate further or contact AT&T Cybersecurity Technical Support.
Topic revision: 29 Mar 2022, SheriffCyberSecurity