Previous Next Sheriff CSM™ NetFlow Troubleshooting If flow data from various NetFlow sources does not appear after a reasonable amount of time, you need to validate that flow data is successfully being transmitted and received by the Sheriff CSM Server. This section provides some specific procedures you can follow to troubleshoot NetFlow data generation, collection, and display. Check that basic system services are running
There are several components involved in the NetFlow generation and collection process. The basic system services that are involved are the following:
-
nfsen -
nfcapd -
fprobe(if using a Sheriff CSM Sensor (Deputy) to generate the flows from a spanned/mirrored port)
nfsend connect() error or nfsend connection failed, this usually occurs because the nfsend process is not running. In that case, you will have to SSH into the system and start nfsen with the service nfsen start command. If there is a configuration error, the command will return an error message and nfsen won't start.
Once nfsen is started, you will see nfcapd started as well, which captures the flows. There should be one nfcapd process running for each Sensor that has NetFlow enabled, as listed on the Administration > Deployment > Sensor page. Each nfcapd process will listen for flows on the port number configured for NetFlow collection on the Sensors NetFlow configuration page in the Sheriff CSM web UI.
NetFlow can either come from external devices that have a dummy Sensor configured to collect NetFlow data, or a Sheriff Sensor configured to generate NetFlow data from a spanned/mirrored port. In the first case, you will need to create a dummy Sensor and enable it for NetFlow collection. Then, you need to configure the external device to send flows to Sheriff CSM on the same port number as configured for that dummy Sensor.
If both nfsen and nfcapd are running but there is no data displayed when you go to the Environment > NetFlow web page, perform the following checks.
Verify that NetFlow data files are being created daily for each Sensor
The nfcapd process for each Sensor writes the flows in a separate directory. You can see the directories by executing the command ps auxww | grep nfcapd and looking for the value of the parameter '-l' in the desired nfcapd process. For example:
ps auxww | grep nfcapd
www-data 25860 0.0 0.0 15756 704 ? S 14:53 0:00 /usr/bin/nfcapd -w -D -p 555 -u www-data -g www-data -B 200000 -S 7 -P /var/nfsen/run/p555.pid -I 564DD32C920DB9686BDCCBBC75CD7822 <b>-l /var/cache/nfdump/flows//live/564DD32C920DB9686BDCCBBC75CD7822</b>
Under that directory there should be several directories, one per day:
ll /var/cache/nfdump/flows/live/564DD32C920DB9686BDCCBBC75CD7822
......
drwxr-xr-x 2 www-data www-data 12288 Oct 6 11:26 2014-10-04
drwxr-xr-x 2 www-data www-data 4096 Oct 6 11:41 2014-10-05
drwxr-xr-x 2 www-data www-data 4096 Oct 6 16:10 2014-10-06
-rw-r--r-- 1 www-data www-data 276 Oct 6 16:10 nfcapd.current
Each directory will contain flow files from the current day. One other important thing to note is that the nfdump command can be used to read the flows files, for example, executing the following command:
nfdump -r nfcapd.xxxxxxxWhen you execute this command, do you see data in the files written by
nfcapd? If there is data, but it does not appear in the Sheriff CSM web UI, it is usually because you have selected a wrong time range.
Verify that nfcapd processes are getting packets
If NetFlow data files are written, but they don't contain any information, you should check if nfcapd processes are getting packets. To do this, you could run the following command:
tcpdump -i any port <PORT>If there is no communication on that port, you need to know if the flow's source is a Sheriff CSM Sensor or another device. If NetFlow data is coming directly from a network device that is generating the NetFlow data, you need to configure that device to send the flows to the dummy Sensor. You may also want to check if there is a firewall blocking communication between the network device and Sheriff CSM. As previously mentioned, a Sheriff CSM Sensor can generate NetFlow data by itself, when configured to listen on a SPAN/mirrored port. In this case, if you don't see traffic on the
nfcapd port, you need to check the sensors NetFlow configuration. The fprobe process listens on the interface port,takes the connection's meta information, and sends it to nfcapd. If you run the command ps auxww | grep fprobe, you will see the interface where each fprobe instance is listening and also the ip:port where fprobe is sending the information. For example:
root 26181 0.0 0.1 47420 6316 ? Ssl 14:53 0:04 /usr/sbin/fprobe -iany -fip 192.168.73.150:555This command specifies the
ip:port where nfcapdis listening. The IP is set to the framework machine, but the port is configurable, either through the Sheriff CSM web UI or the sheriff-setup program (Configure Sensor > Enable NetFlow Generator > yes and then set the desired port).
Validate that NetFlow packets are being generated by the Sheriff CSM Sensor
If you are collecting NetFlow packets from a third-party device (using a dummy Sheriff CSM Sensor), perform whatever troubleshooting is appropriate to determine that NetFlow collection is functioning correctly on that device. For sources that are using a Sheriff CSM Sensor to monitor network traffic and generate NetFlow data from a SPAN/mirrored port, you can follow these steps to validate that NetFlow packets are being generated by the Sheriff CSM Sensor: -
SSH into the Sheriff CSM Sensor.
-
Launch the Sheriff Console and select the Jailbreak System option to access the command line.
-
Run the following command to validate that fprobe is running, that it is listening to the correct interface, and that it is sending packets on the correct port to the Sheriff CSM Server.
# ps ax|grep fprobe
The output from this command should appear similar to the following:

-
Confirm that
–iethXis the correct interface number for the Sensor interface connected to the switch SPAN port. -
Confirm that the IP address returned is the IP address of the Sheriff CSM Server.
-
Confirm that the port number (following the IP address) is the same number you specified in the Sheriff CSM web UI for the NetFlow configuration.
fprobe and nfcapd and the NetFlow directory files are written, but running the nfdump command indicates the nfcapd process still isn't receiving NetFlow data, the problem may be due to the following: -
The Sensor is not configured to listen using the correct interfaces. (Check Configure Sensor > Configure Network Monitoring.)
-
The interface is not receiving traffic (usually due to faulty configuration of the port mirroring). You could check the configuration with the command
tcpdump -i <interface>. -
The interface is receiving traffic, but it is not purely IP traffic. For example, if the interface is receiving tagged VLAN traffic,
fprobeis not going to capture the traffic, because generation of NetFlow data from VLAN traffic is not supported. To check if you are monitoring purely IP traffic, you can run the commandtcpdump -i <interface> ip.
-
SSH into the Sheriff CSM Server.
-
Launch the Sheriff Console and select the Jailbreak System option to access the command line.
-
Validate that
nfcapdis running, and listening on the port assigned for the appropriate Sensor, by running the following command:# ps ax|grep nfcapd
The output should appear similar to the following

- There will be multiple instances of nfcapd, one for each NetFlow source.
- The number after the –p argument should match the port assigned to a particular NetFlow source.
-
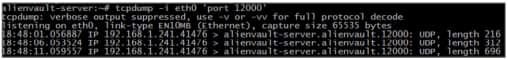
Use
tcpdumpto validate that packets are being transmitted to the Sheriff CSM Server# tcpdump –I <interface> ‘port <!netFlow port>’
If packets are being received from the NetFlow source, you should see output similar to the following:
-
Use Ctrl-C to exit tcpdump.

-
SSH into the Sheriff CSM Server.
- Launch the Sheriff Console and select the Jailbreak System option to access the command line.
-
Validate that the firewall configuration has an exception configured to allow incoming NetFlow data packets over the appropriate UDP port.
# iptables –L –n –v |grep <configured port>
The output should resemble the following:

The
udp dptsegment (destination port) is the important part here, indicating that traffic will be ACCEPTed by the firewall configuration. The number in the left column indicates the number of packets that have previously matched this ACCEPT rule.
Topic revision: 04 Jun 2022, SheriffCyberSecurity