Previous Next
Sheriff CSM™
NetFlow Monitoring Configuration
Many external NetFlow sources (such as routers and switches) have NetFlow capabilities already defined in their operating firmware and usually require only some minimal configuration to enable it. NetFlow collection is entirely dependent upon having visibility to traffic traversing the network, which means the routers and switches that traffic flows over. There are two ways to acquire this, with both options supported by Sheriff CSM:-
Method 1: A network device is configured with a SPAN/Mirror port to clone all traffic to a single port, which is attached to an existing Sheriff CSM Sensor (Deputy). The Sheriff CSM Sensor, connected to the SPAN port, generates NetFlow data from the observed network traffic.
-
Method 2: Network devices are configured to generate NetFlow data, and then transmit it directly to Sheriff CSM Server (through a pseudo or "dummy" configured Sheriff CSM Sensor). NetFlow data is sent from the NetFlow source to the dummy Sensor, which transmits the NetFlow data to the Sheriff CSM Server.


- Go to Configuration > Deployment.
-
Select the Components > Sensors tab.

-
Click the IP Address of the Sensor you want to configure to collect NetFlow source traffic information and generate NetFlowdata to send to Sheriff CSM Server.
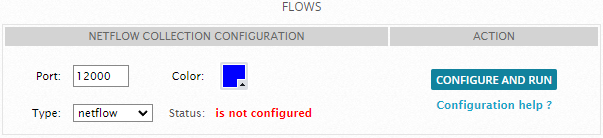
Sheriff CSM displays the main Sensor configuration screen, with the NetFlowCollection Configuration detail appearing at the very bottom.

There are three primary configuration options, all of which may safely be left with their default values:
- Port — This is the port on which the Sheriff CSM Sensor will transmit NetFlowdata back to the Sheriff CSM Server. Each Sensor must transmit on a unique port number. A suitable default port number that you can use will appear in this text box. You can use this port unless you have a specific operational reason to choose another port, perhaps, because your network has a specific port range assigned for administrative traffic ACLs.
- Type — This is the type of NetFlowdata that the Sensor will receive from external sources. If you are only using the Sheriff CSM Sensor to generate NetFlowdata, you can keep the default setting.
Note : Generally acceptable options are NetFlow and sFlow. In short, NetFlowprovides IP flow aggregation, while sFlow provides sampled network data. Your selection of NetFlowtype depends on the network device used, and its configuration. If you use Cisco or Enterasys network devices, select NetFlow. For other vendors, select sFlow.
- Color — A color value to visually identify flows collected from this Sensor in the Flows analysis section of the Sheriff CSM Web UI Environment > NetFlowweb page.
-
Once you have chosen appropriate values (or kept their default settings), click Configure and Run to activate NetFlow collection/generation from this Sensor.
The configuration section is updated to indicate that NetFlowcollection for the Sheriff CSM Sensor is now configured.

- Log into the external Sensor using SSH and the credentials needed to gain access to the Sensor.
-
From the Setup menu, select the Configure Sensor > Enable NetFlowGenerator option.
-
Set the Enable NetFlowGenerator option to yes.
-
Click OK.
You are now prompted to specify the Remote Collector Port. This is the port on which the Sensor will transmit NetFlowdata back to the Sheriff CSM Server.
-
Specify the same port number as you selected in Step 3 of the previous procedure, “Enabling NetFlowCollection from an Existing Sheriff CSM Sensor (Method 1) ”.
-
Click OK.
-
Return to the main Setup menu and select Apply all Changes.
-
Exit the Setup menu and log off the Sensor.
Note: Configuring a Sheriff CSM "dummy" Sensor just sets up a "listener" interface for the NetFlow source to send NetFlow data directly to the Sheriff CSM Server. To enable NetFlow collection from a new Sheriff CSMdummy Sensor
-
Go to Configuration > Deployment.
-
Select the Components > Sensors tab.
-
Click New to create a new Sensor.
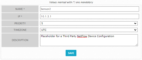
Sheriff CSM opens the Sensor configuration page.
-
Specify a name and description to identify the new Sensor and the IP Address of the network device sending NetFlow data to Sheriff CSM.
-
Click Save.
Sheriff CSM return to the Components > Sensors page, now listing the new Sensor you just created.

-
Select the new Sensor you just created, and click Modify.
-
Scroll down the Sensor configuration page to the Services section and disable all services.
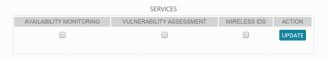
This step is not essential, but it prevents this "dummy" Sensor from showing up as an available Sensor under several configuration sub-menus. When displaying a list of Sensors in the Sheriff CSM web UI, the dummy Sensor will show up in the Sensor list, but will display the status as down, as the Sensor will not respond to API requests.
-
Scroll further down the Sensor configuration page to the Flows section.
There are three primary configuration options, all of which may safely be left with their default values:
- Port — This is the port on which the Sheriff CSM Sensor will transmit NetFlow data back to the Sheriff CSM Server. Each Sensor must transmit on a unique port number. A suitable default port number that you can use will appear in this text box. You can use this port unless you have a specific operational reason to choose another port, perhaps, because your network has a specific port range assigned for administrative traffic ACLs.
- Type — This is the type of NetFlow data that the Sensor will receive from external sources. If you are only using the Sheriff CSM Sensor to generate NetFlow data, you can keep the default setting.
Note: Generally acceptable options are NetFlow and sFlow. Your selection of NetFlow type depends on the network device used, and its configuration. If you use Cisco or Enterasys network devices, select NetFlow. For other vendors, select sFlow.
- Color — A color value to visually identify flows collected from this Sensor in the Flows analysis section of the Sheriff CSM Web UI Environment > NetFlow web page.
-
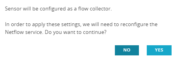
Once you have chosen appropriate flow configuration values (or kept their default settings), click the Configure and Run button to configure and activate !NetFlow data collection from this Sensor.
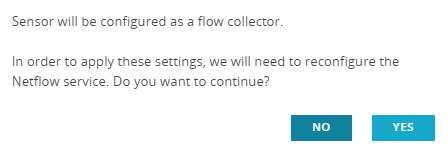
Sheriff CSM displays a dialog box prompting you to confirm configuration changes to the new Sensor.
-
Click Yes.
Sheriff CSM applies the required Sensor changes and then returns to the listing of configured Sensors.
Note: After making Sensor configuration changes to enable NetFlow capture, make sure that you also configure your network device to match settings specified in the Sensor configuration detail. Refer to vendor documentation available for your network devices for any specific configuration required to enable or configure NetFlow data collection and generation.


-
Select the Environment > NetFlow menu option.
Sheriff CSM displays the following page.
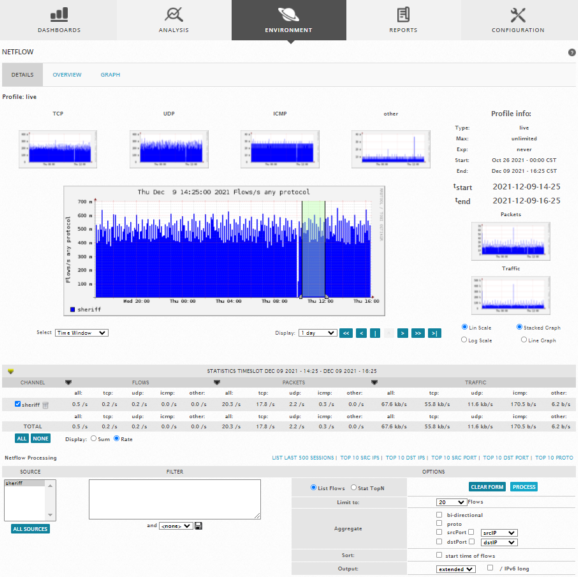
The main NetFlow web page provides three different tab selections, Details (the default), Overview, and Graph. The graphs displayed on the Details page provide a quick visual confirmation that NetFlow data is being captured. The colors used to plot the flow graphs are the colors assigned to each Sensor as part of their configuration.
The Detail page also provides statistics for flows, packets, and traffic. Statistics are displayed separately for TCP, UDP, ICMP, and other protocols. The NetFlow page provides separate graphics and statistics for each NetFlow data source. In addition, you can adjust the time frame for a graph, by moving the sliders in the time line, or specifying a time range from the Display drop-down menu.
-
In the middle section of the NetFlow Detail page, you can toggle the selection of statistics and graphs for data from different NetFlow sources. You can focus the display on individual flow sources by selecting a particular NetFlow source in the bottom portion of the Detail page, labelled NetFlow P processing

-
You can further qualify NetFlow data by clicking on one of the predefined processing options, such as List Last 500 Sessions or Top 10 Src Ports, as well as selecting options from the Options section.
The following display shows a sample of results for List Last 500
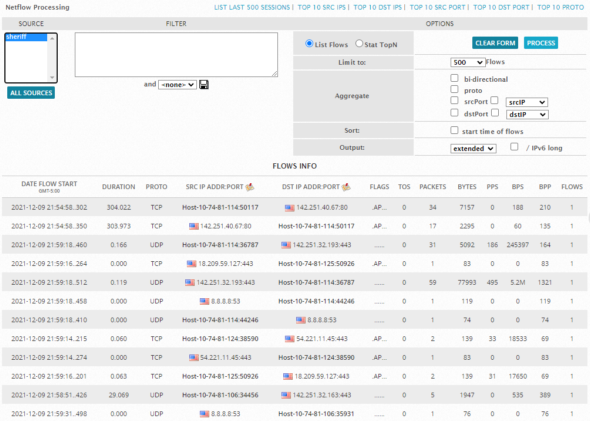
You can define more specific selection criteria for NetFlow data displays in the Filter box, for example:
ip x.x.x.x

You can find more filter examples at http://biot.com/capstats/bpf.html


Topic revision: 25 Apr 2022, SheriffCyberSecurity