Previous Next Sheriff CSM™
Analyzing Alarms, Events, Logs, and Tickets
You will likely spend the most time reviewing and analyzing the network security of your environment using various options provided in the Sheriff CSM web UI Analysis menu. The Analysis menu provides the following submenu selections:-
Alarms — Shows all the alarms generated in Sheriff CSM. (Any event with a calculated risk value of 1 or greater generates an alarm.) You can also search for alarms using filters.
-
Security Events (SIEM) — Displays all events that were processed or generated by the Sheriff CSM Server. You can also search and filter events that appear in the display as well as view details of specific events.
-
Tickets — Provides access to Sheriff CSM ticket management system. Tickets provide workflow tracking of activity related to detected alarms or any other issues that you want to keep track of.
The Alarms Page Display
When you select the Analysis > Alarms option, Sheriff CSM displays the following page. By default, the display opens in List View, which simply lists alarms in reverse chronological order (the latest issued alarm is displayed first). You can also change the display to Group View, which allows you to group alarms by different keys such as alarm name, source and destination IP address, or alarm type.
The middle portion of the screen includes a table that provides a graphical aggregated representation of alarms that occurred in the last 31 days; each column represents a different day. Blue circles indicate the number of times that an alarm in a category appeared. A bigger circle indicates a higher number of alarms were generated. You can mouse over each of the circles to get the actual number of different types of events that occurred as well as a Top 5 list of possible remedies for each alarm type.
Alarms are sorted into five different categories, which are represented by the graphic icons in the display. These are:
By default, the display opens in List View, which simply lists alarms in reverse chronological order (the latest issued alarm is displayed first). You can also change the display to Group View, which allows you to group alarms by different keys such as alarm name, source and destination IP address, or alarm type.
The middle portion of the screen includes a table that provides a graphical aggregated representation of alarms that occurred in the last 31 days; each column represents a different day. Blue circles indicate the number of times that an alarm in a category appeared. A bigger circle indicates a higher number of alarms were generated. You can mouse over each of the circles to get the actual number of different types of events that occurred as well as a Top 5 list of possible remedies for each alarm type.
Alarms are sorted into five different categories, which are represented by the graphic icons in the display. These are:
- System compromise (
 )
)
- Exploitation and installation (
 )
)
- Delivery and attack (
 )
)
- Reconnaissance and probing (
 )
)
- Environmental awareness (
 )
)
The Security Events (SIEM) Page Display
When you select the Analysis > Security Events (SIEM) menu option, Sheriff CSM displays the following page.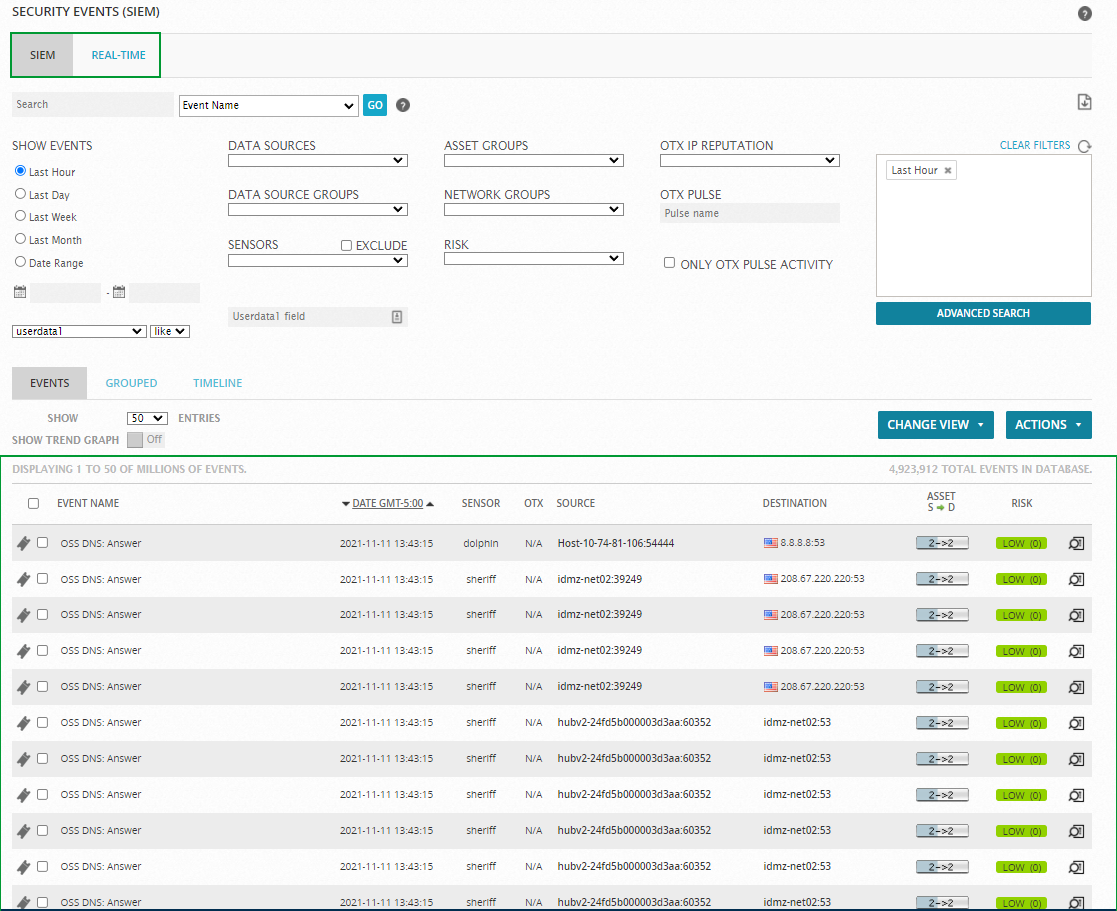 By default, the Security Events (SIEM) page displays a SIEM view of events. The Sheriff CSM web UI also provides two other options for displaying security events:
 -
Real-Time — view that shows events in progress in your network.
-
External Databases — display security events from an external Sheriff database that is associated with a different Sheriff CSM installation. For more information on configuring a connection to an external Sheriff database, see How to display Security Events from an External Sheriff Database.
The Tickets Page Display
When you select the Analysis > Tickets option, Sheriff CSM displays the following page.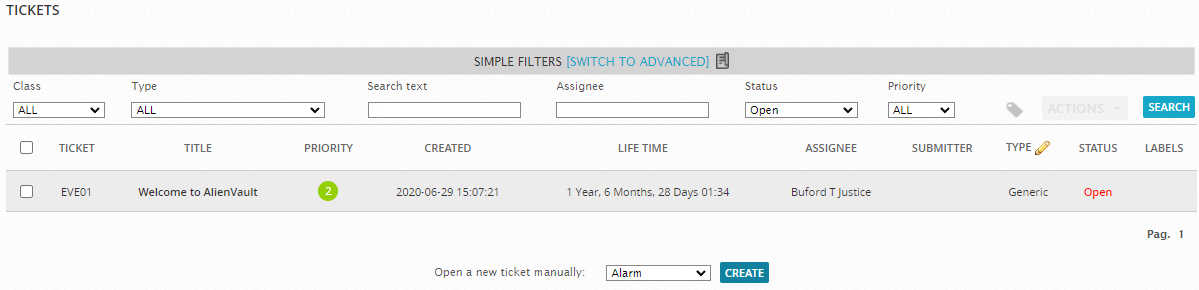 This page provides access to the Sheriff CSM ticket remediation system. Tickets provide workflow tracking of activity related to detected alarms or any other issues that you want to keep track of. By default, the Sheriff CSM web UI displays a list of all tickets. In addition, you can click the Create button to create a new ticket of a specific type or category.
In the Filters section at the top of the Tickets page, you can choose criteria to filter the ticket results. You can choose additional criteria to filter ticket results by clicking the Switch to Advanced option.
From the Ticket summary list, you can click on a specific ticket to open the ticket and display the entire details of the ticket on a new page. From this ticket detail display, you can perform various actions such as editing fields in the ticket, assigning the ticket, adding notes and attachments, and changing the status and priority of a ticket, depending on whatever method or process you want to use to track resolution of issues.
This page provides access to the Sheriff CSM ticket remediation system. Tickets provide workflow tracking of activity related to detected alarms or any other issues that you want to keep track of. By default, the Sheriff CSM web UI displays a list of all tickets. In addition, you can click the Create button to create a new ticket of a specific type or category.
In the Filters section at the top of the Tickets page, you can choose criteria to filter the ticket results. You can choose additional criteria to filter ticket results by clicking the Switch to Advanced option.
From the Ticket summary list, you can click on a specific ticket to open the ticket and display the entire details of the ticket on a new page. From this ticket detail display, you can perform various actions such as editing fields in the ticket, assigning the ticket, adding notes and attachments, and changing the status and priority of a ticket, depending on whatever method or process you want to use to track resolution of issues.Topic revision: 16 Jun 2022, SheriffCyberSecurity